Parametric Equations
Rozina Essani
Using Graphing
Calculator let us see how the graphs of these parametric equations appear for
the given
![]()

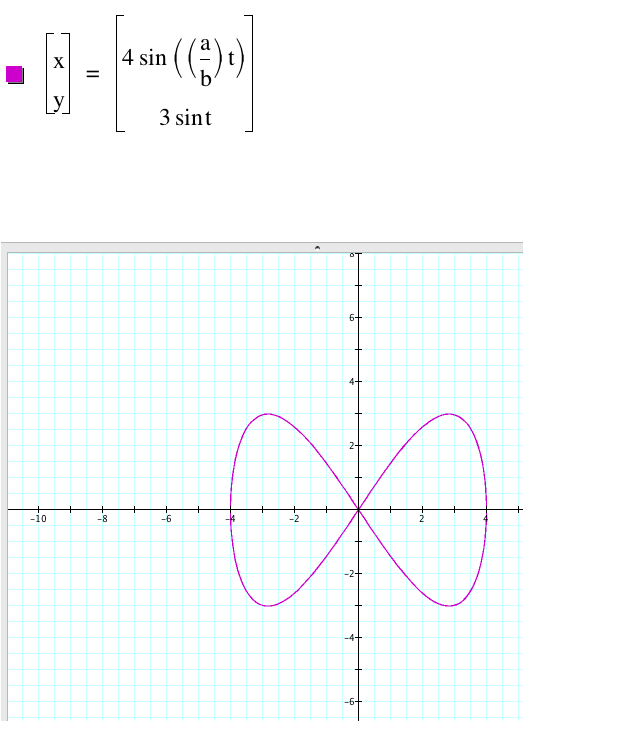
For this choice of a and b we get a curve that looks like a bowtie. The domain
of the curve is from -4 to 4 and the range -3 to 3 which
are our coefficients for the x and y respectively. The point of intersection
(or where the curve overlaps) is (0,0).
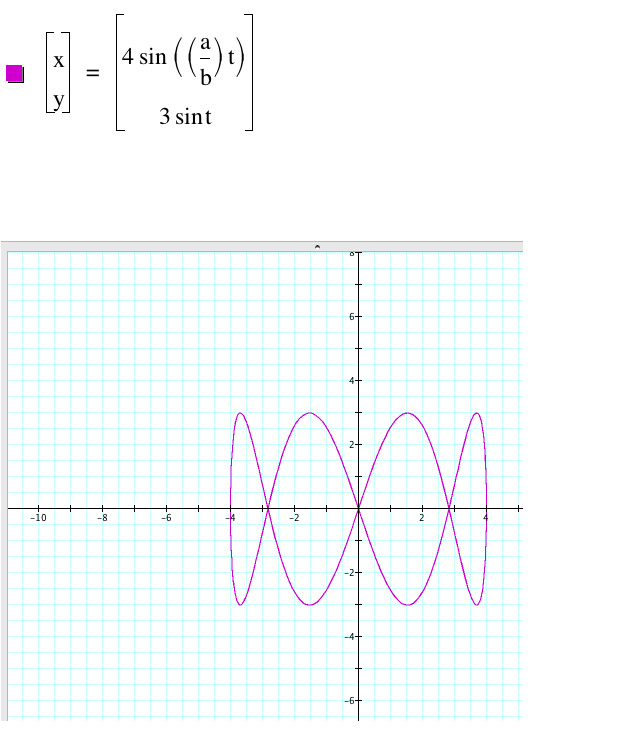
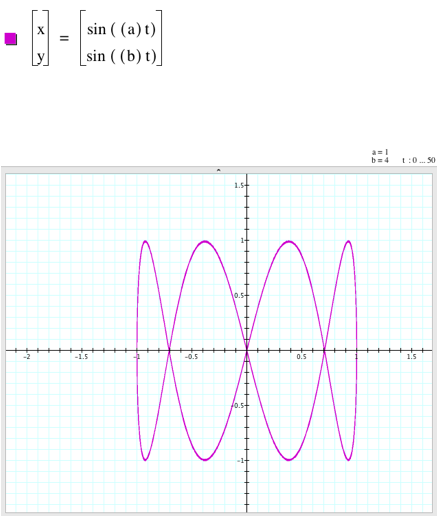
When we increase b to 4
we see that now we have four loops in the same domain and range. When we
increase b to any positive even integer we get that many loops, so for instance
a=1 and b=6 will give us six loops. The curve overlaps at (0,0) and at around
x=-2.75 and 2.75.
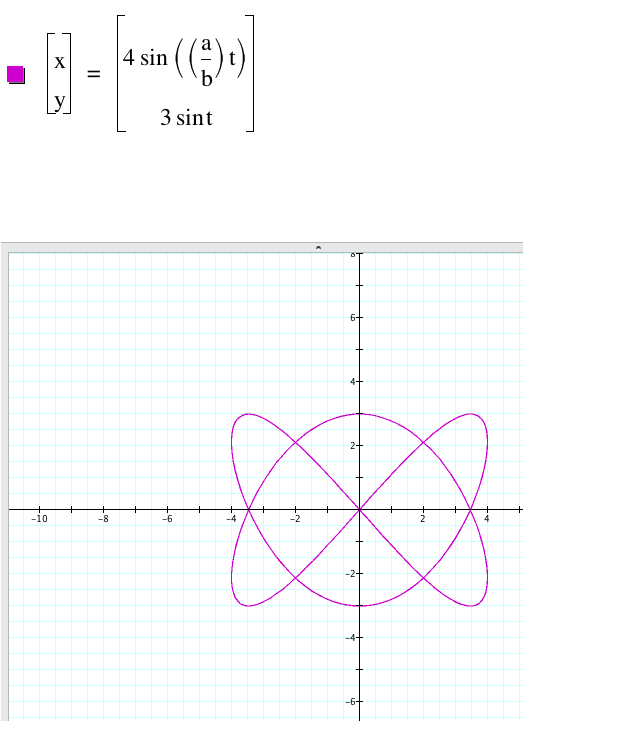
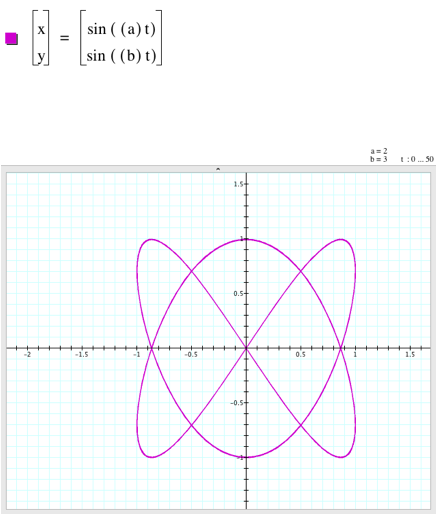
Here we see that a=2
and b=3 gives us a curve which looks like two boomerangs facing each other. The
curve overlaps at (0,0), around (-2,2), (-2,-2),
(2,2), (2,-2), and around x=-3.5 and 3.5.
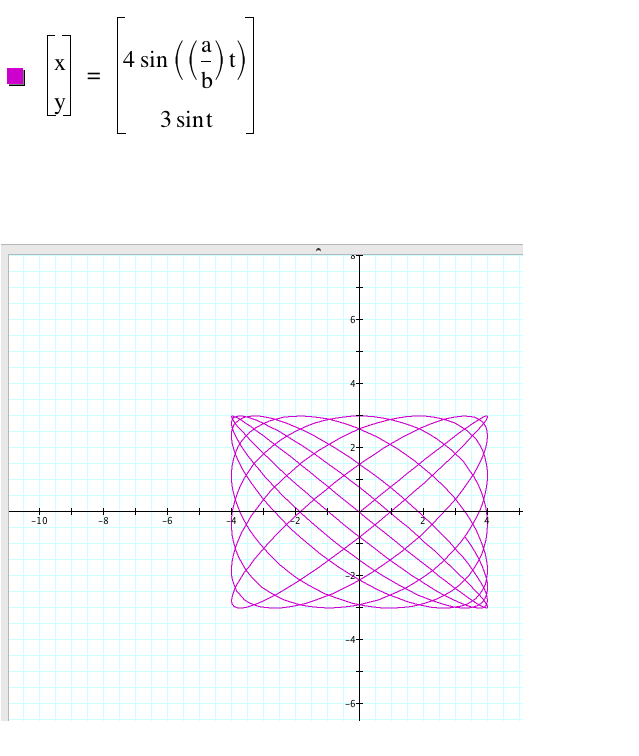
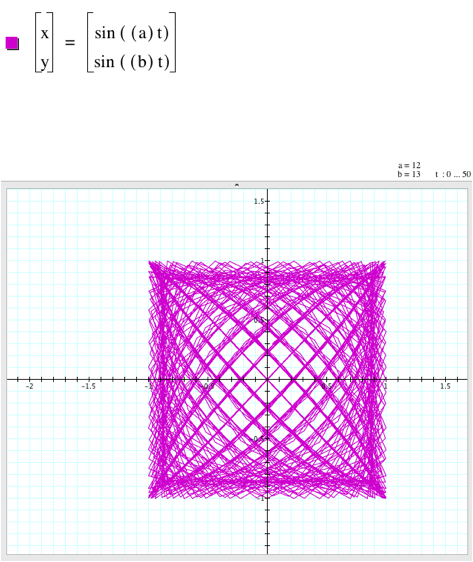
Increasing a and b to 12 and 13 respectively we get a more busy
curve. We get a lot more
intersection points, or points where the curve overlaps.
Let us now compare
these Lissajous curves with

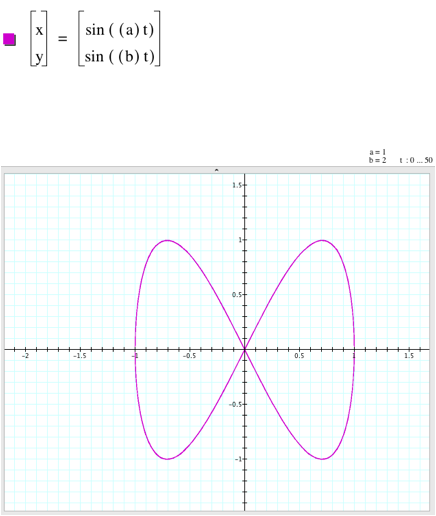
With these graphs our
domain and range is -1 to 1, 1 also being the coefficient of our sin equations.
The graphs are identical except for when a=12 and b=13. Instead of a smooth
curve, it is made of multiple jagged lines.